
The OC Housing Report – March 16, 2026
How Global Tensions Are Impacting Housing
There’s a new variable influencing the Orange County housing market — and it’s not local.
International tensions and rising gas prices are creating ripple effects that are directly impacting mortgage rates. While the housing market was beginning to stabilize with rates near 6%, recent global events have pushed them back up.
Here’s exactly what’s happening — and what it means for buyers and sellers right now.
(Full March 16, 2026 Housing Report: )
Mortgage Rates Rebound from 5.99% to 6.36%
After dipping to 5.99% in late February, mortgage rates climbed to 6.36% following the Iran conflict and rising gas prices.
Gas in California:
February 28 → $4.64/gallon
Today → $5.53/gallon (+19%)
Rising energy costs triggered renewed inflation concerns, which pushed bond yields higher — and mortgage rates followed.
For a $1M mortgage:
At 5.99% → $5,989/month
At 6.36% → $6,229/month
Increase → $240/month ($2,880/year)
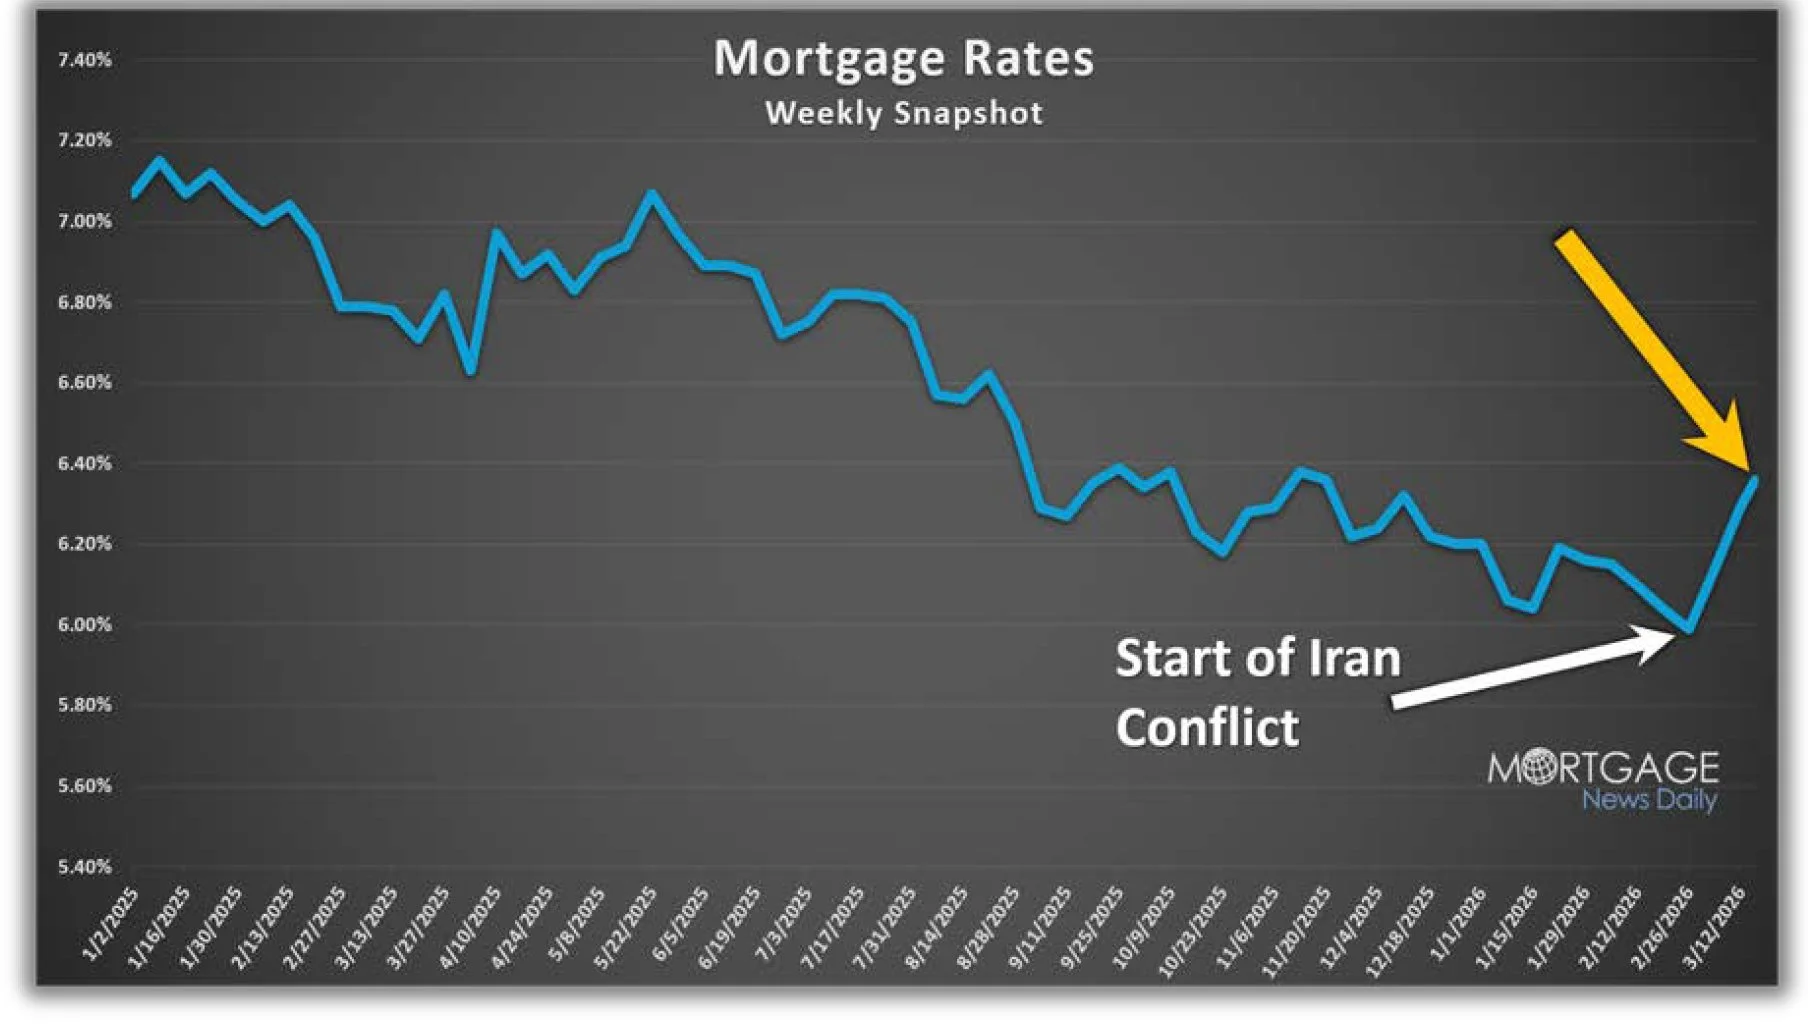
Mortgage Rates Weekly Snapshot (Page 2)
This chart shows the immediate rate spike following the start of the Iran conflict.
Important context:
Rates are still lower than last year’s 6.8%–7% range. But volatility is back.
Demand Is Still Rising
Despite rate movement, buyer demand increased 6% over the past two weeks.
Current pending sales → 1,639
Last year → 1,665 (-2%)
Pre-pandemic average → 2,429 (+48%)
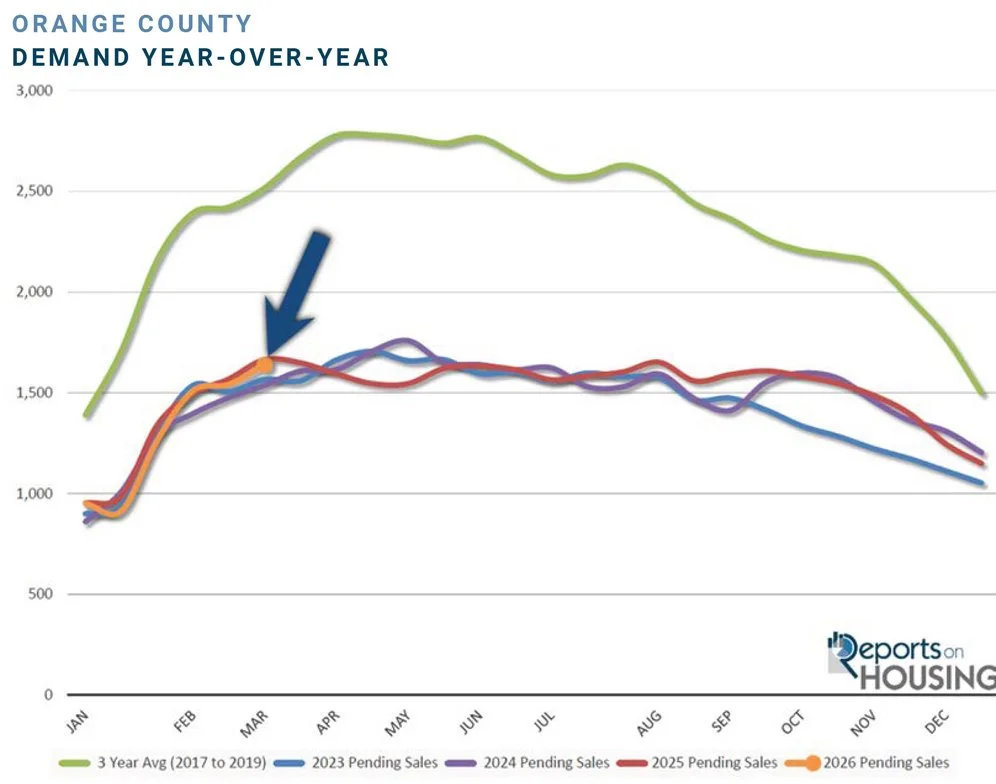
Demand Year-Over-Year Chart (Page 3)
Shows demand stabilizing but still below pre-COVID levels.
Spring Market is approaching — typically the busiest time of year (April–May). Demand is expected to peak soon.
If mortgage rates climb above 6.5%, we could see demand flatten.
If rates fall back toward 6% (or lower), demand could accelerate meaningfully.
Inventory Continues to Climb
Active listings increased by 156 homes (up 4%) to 3,687 homes.
Year-to-date:
Inventory up 36% (from 2,703 to 3,687)
7% higher than last year
Still 38% below pre-COVID average
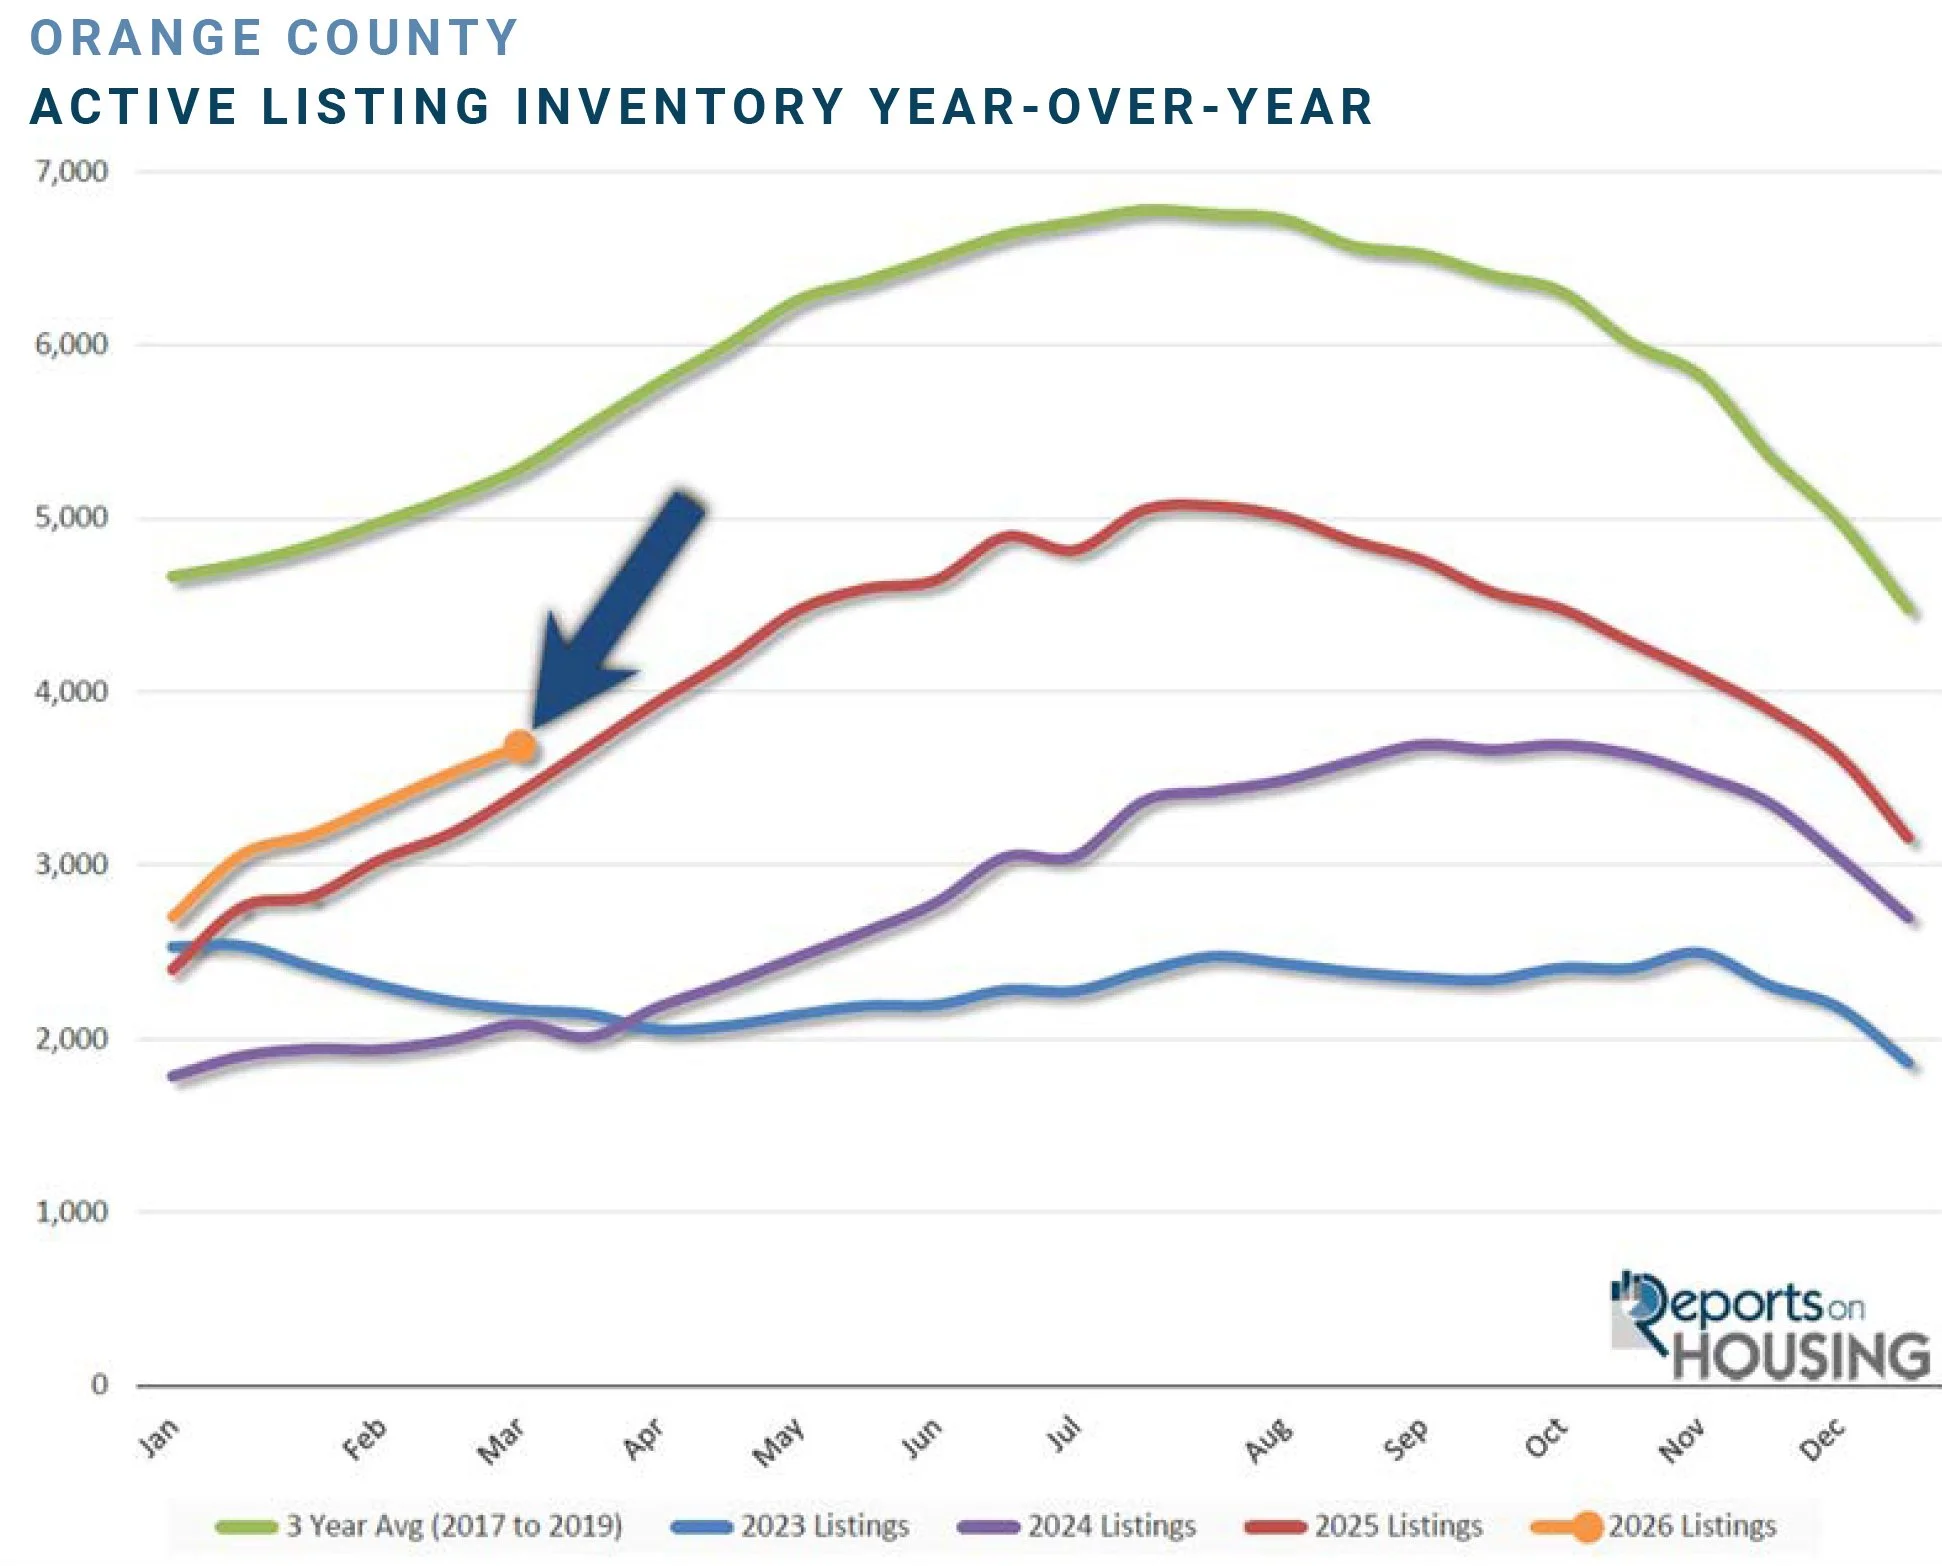
Active Listing Inventory Year-Over-Year (Page 4)
Shows inventory rising but not oversupplied.
As we move deeper into Spring, expect inventory to climb until July/August.
Market Speed Improves Slightly
Even with rising rates:
Demand ↑ 6%
Supply ↑ 4%
Expected Market Time ↓ from 69 to 67 days
That’s the fastest pace of the year.
Detached homes:
64 days (faster than attached)
Condos/townhomes:
74 days (slower than detached)
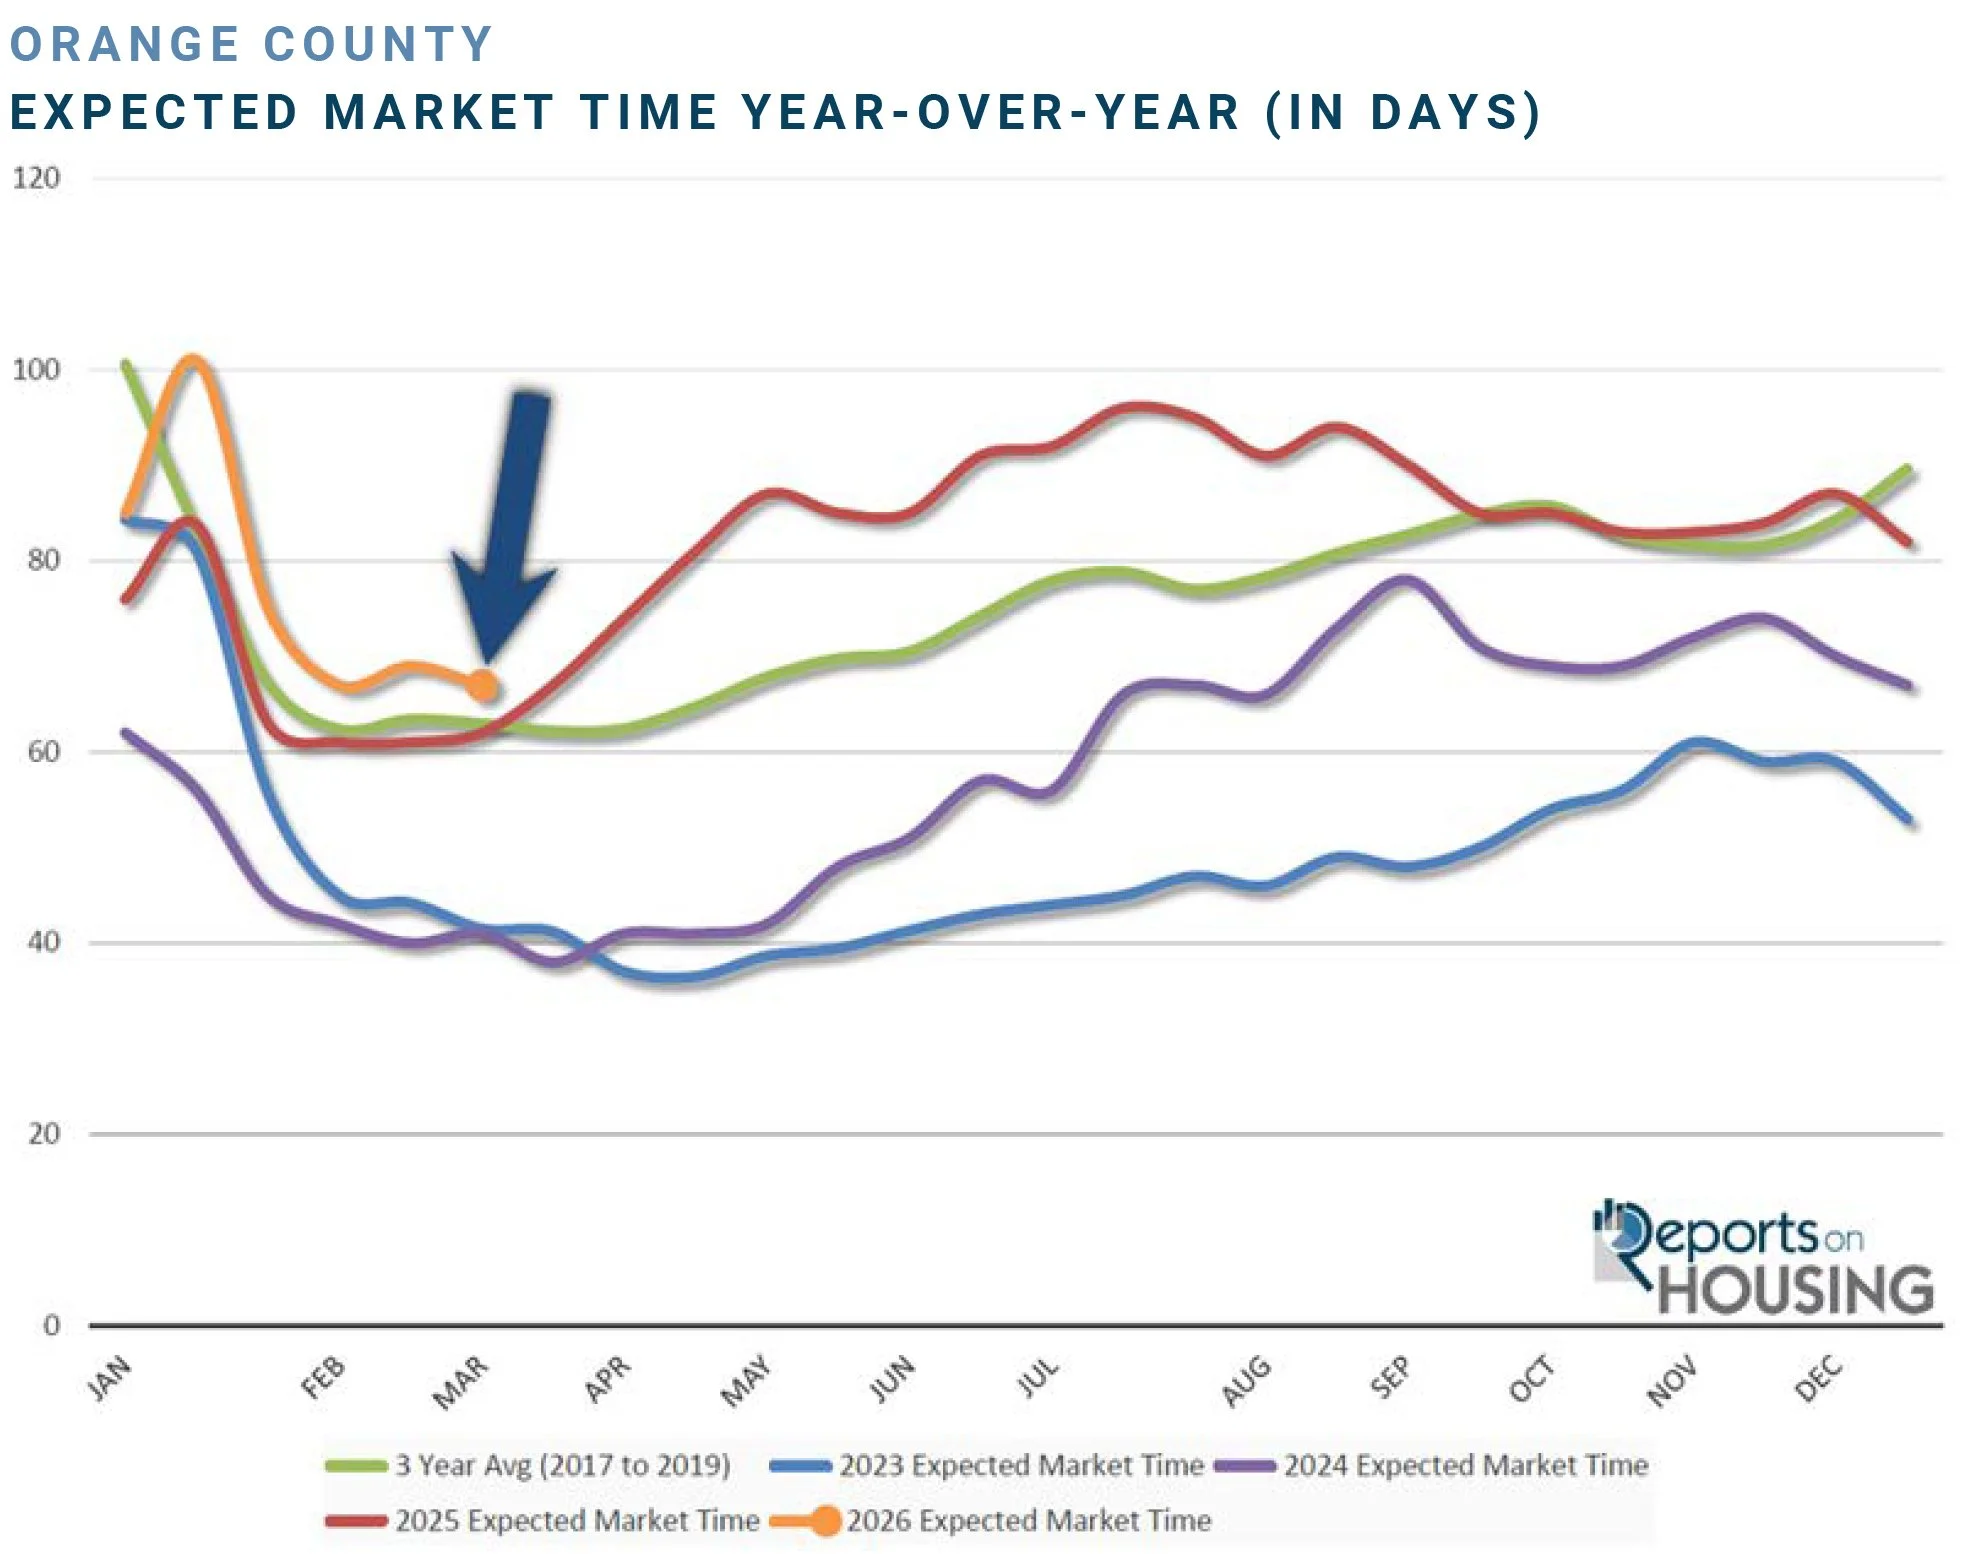
Expected Market Time Year-Over-Year (Page 6)
Shows current speed relative to past cycles.
The market is competitive — but not frenzied.
Luxury Market Update ($2.5M+)
Luxury inventory:
900 homes (+5%)
Luxury demand:
180 pending sales (+4%)
Luxury Expected Market Time:
150 days overall
Breakdown:
$2.5M–$4M → 123 days
$4M–$6M → 111 days
$6M+ → 330 days
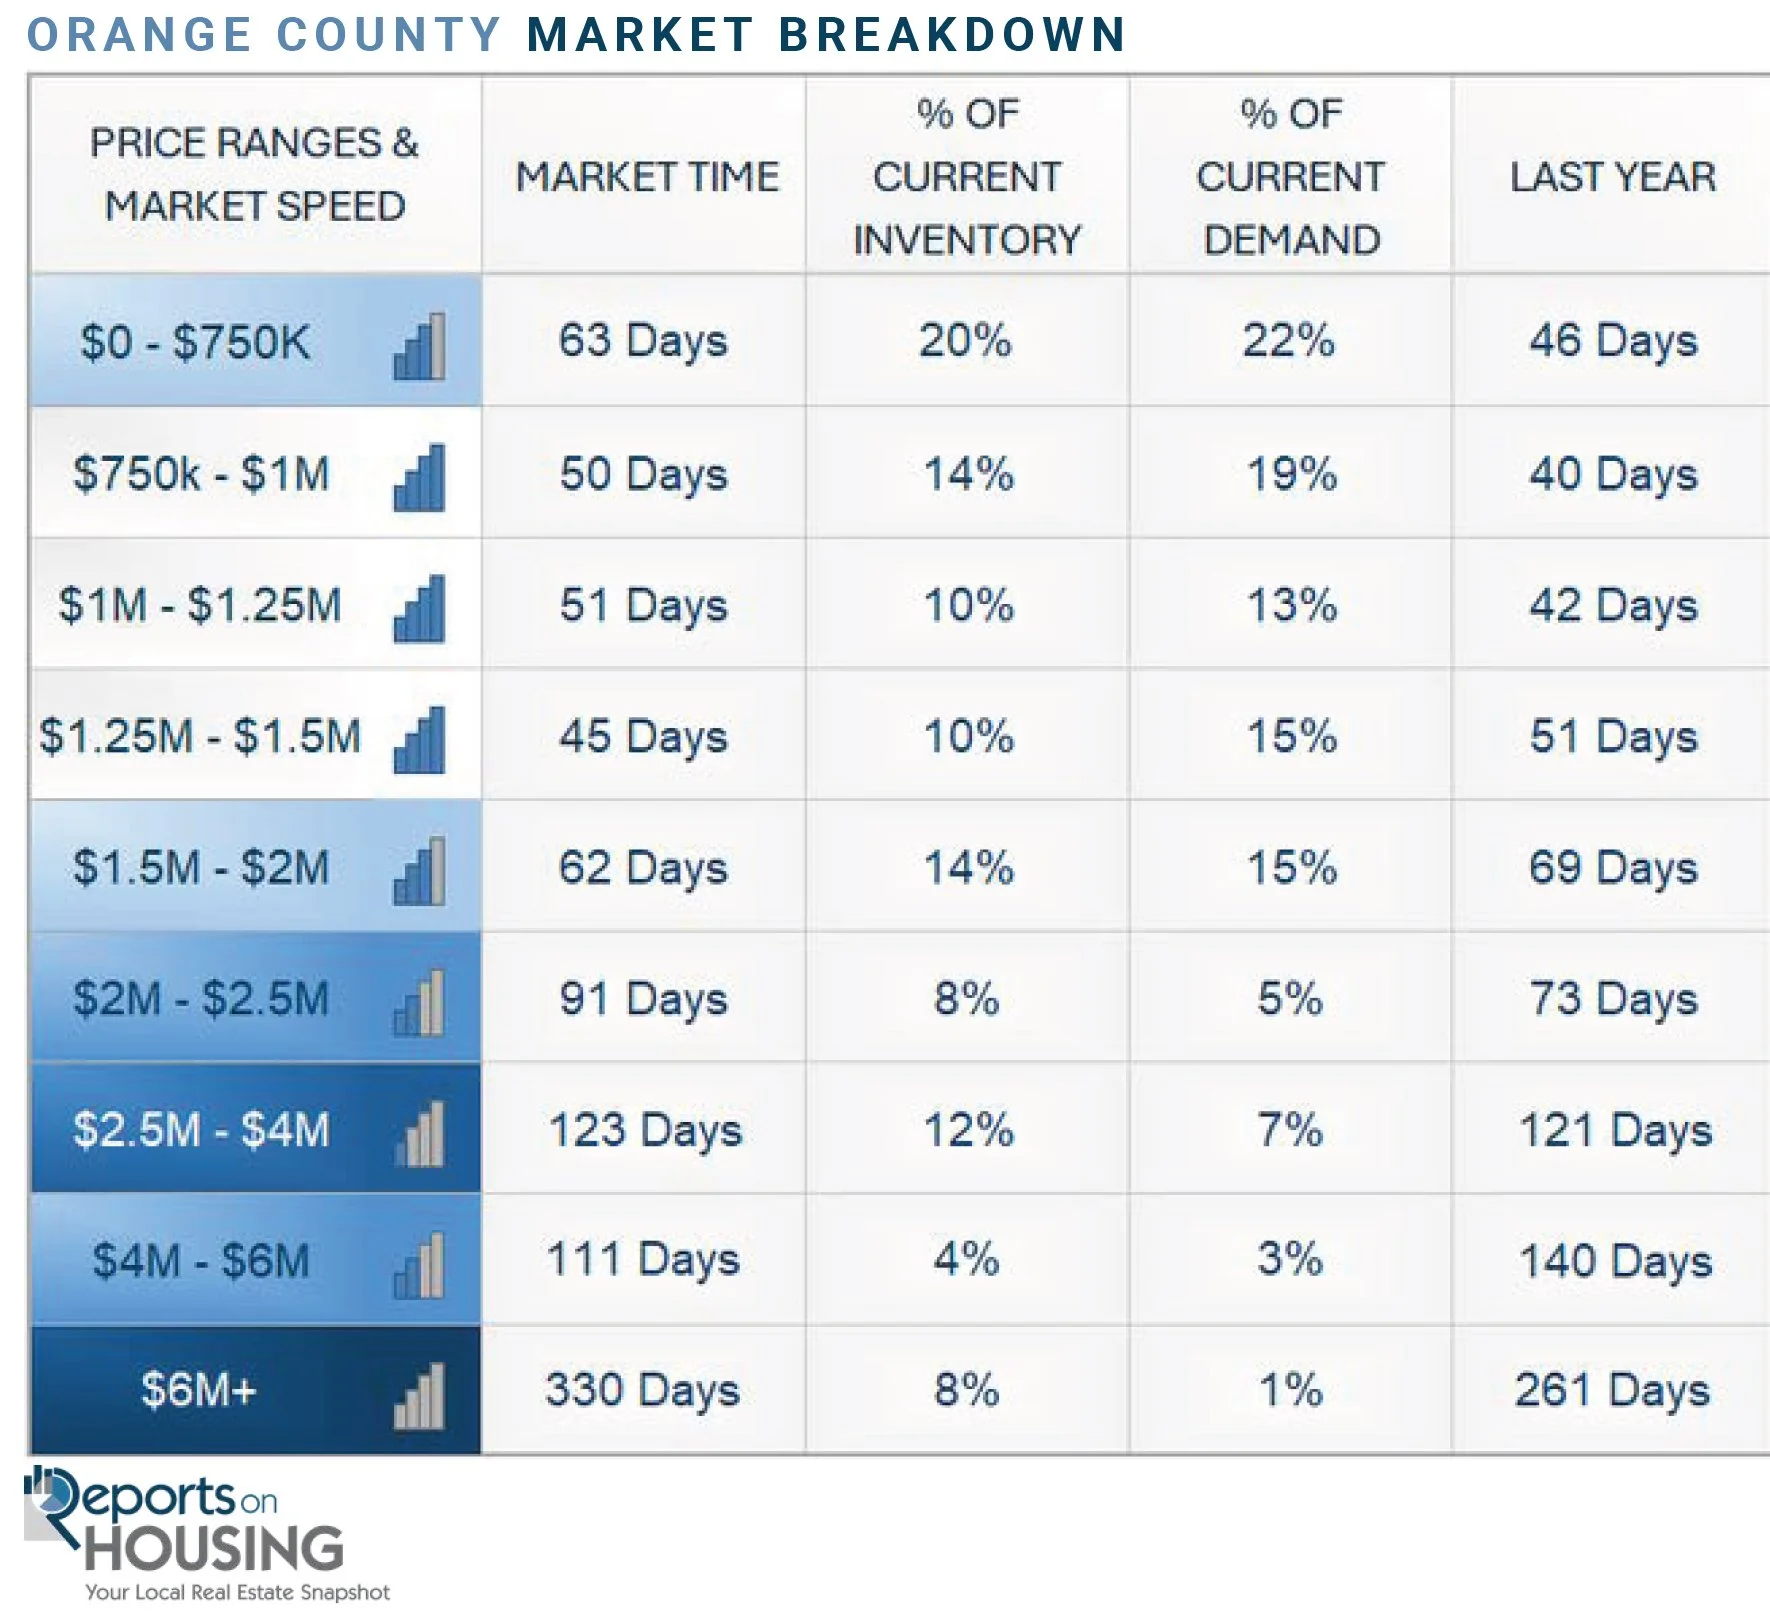
Luxury End Breakdown Table (Page 7)
Luxury remains highly sensitive to economic volatility and stock market swings.
Key Takeaways
✔ Global events can quickly move mortgage rates
✔ Rates are higher than a few weeks ago — but still lower than last year
✔ Inventory is rising into Spring
✔ Demand is increasing despite rate volatility
✔ Market time remains stable at 67 days
Strategy Right Now
For Sellers:
Do NOT speculate on rate direction.
Price with precision. Overpricing wastes time in a competitive Spring market.
For Buyers:
Waiting for “perfect conditions” is often an exercise in futility.
Rates are still better than last year, and inventory is improving.
If you’d like a customized analysis of how this impacts your specific property or buying power, reach out directly.
Full Report: